NAA Inflation Tracker: July 2022
Once again, the headline inflation number beat analysts’ expectations, rising 9.1% year-over-year (unadjusted) and 1.3% over the month. Energy prices, up 7.5% since last month, were responsible for nearly half of the increase. Core inflation (excluding food and energy prices) was up 5.9% year-over-year, the slowest rate of increase in 2022. The main drivers for core CPI were new vehicles, used cars and trucks, and shelter costs.
The June jobs report, which came in much higher than expected with 372,000 jobs added and the unemployment rate remaining stable, is a signal to the Fed that the labor market is nowhere close to cooling and makes a good case to continue more aggressive monetary policy tightening.
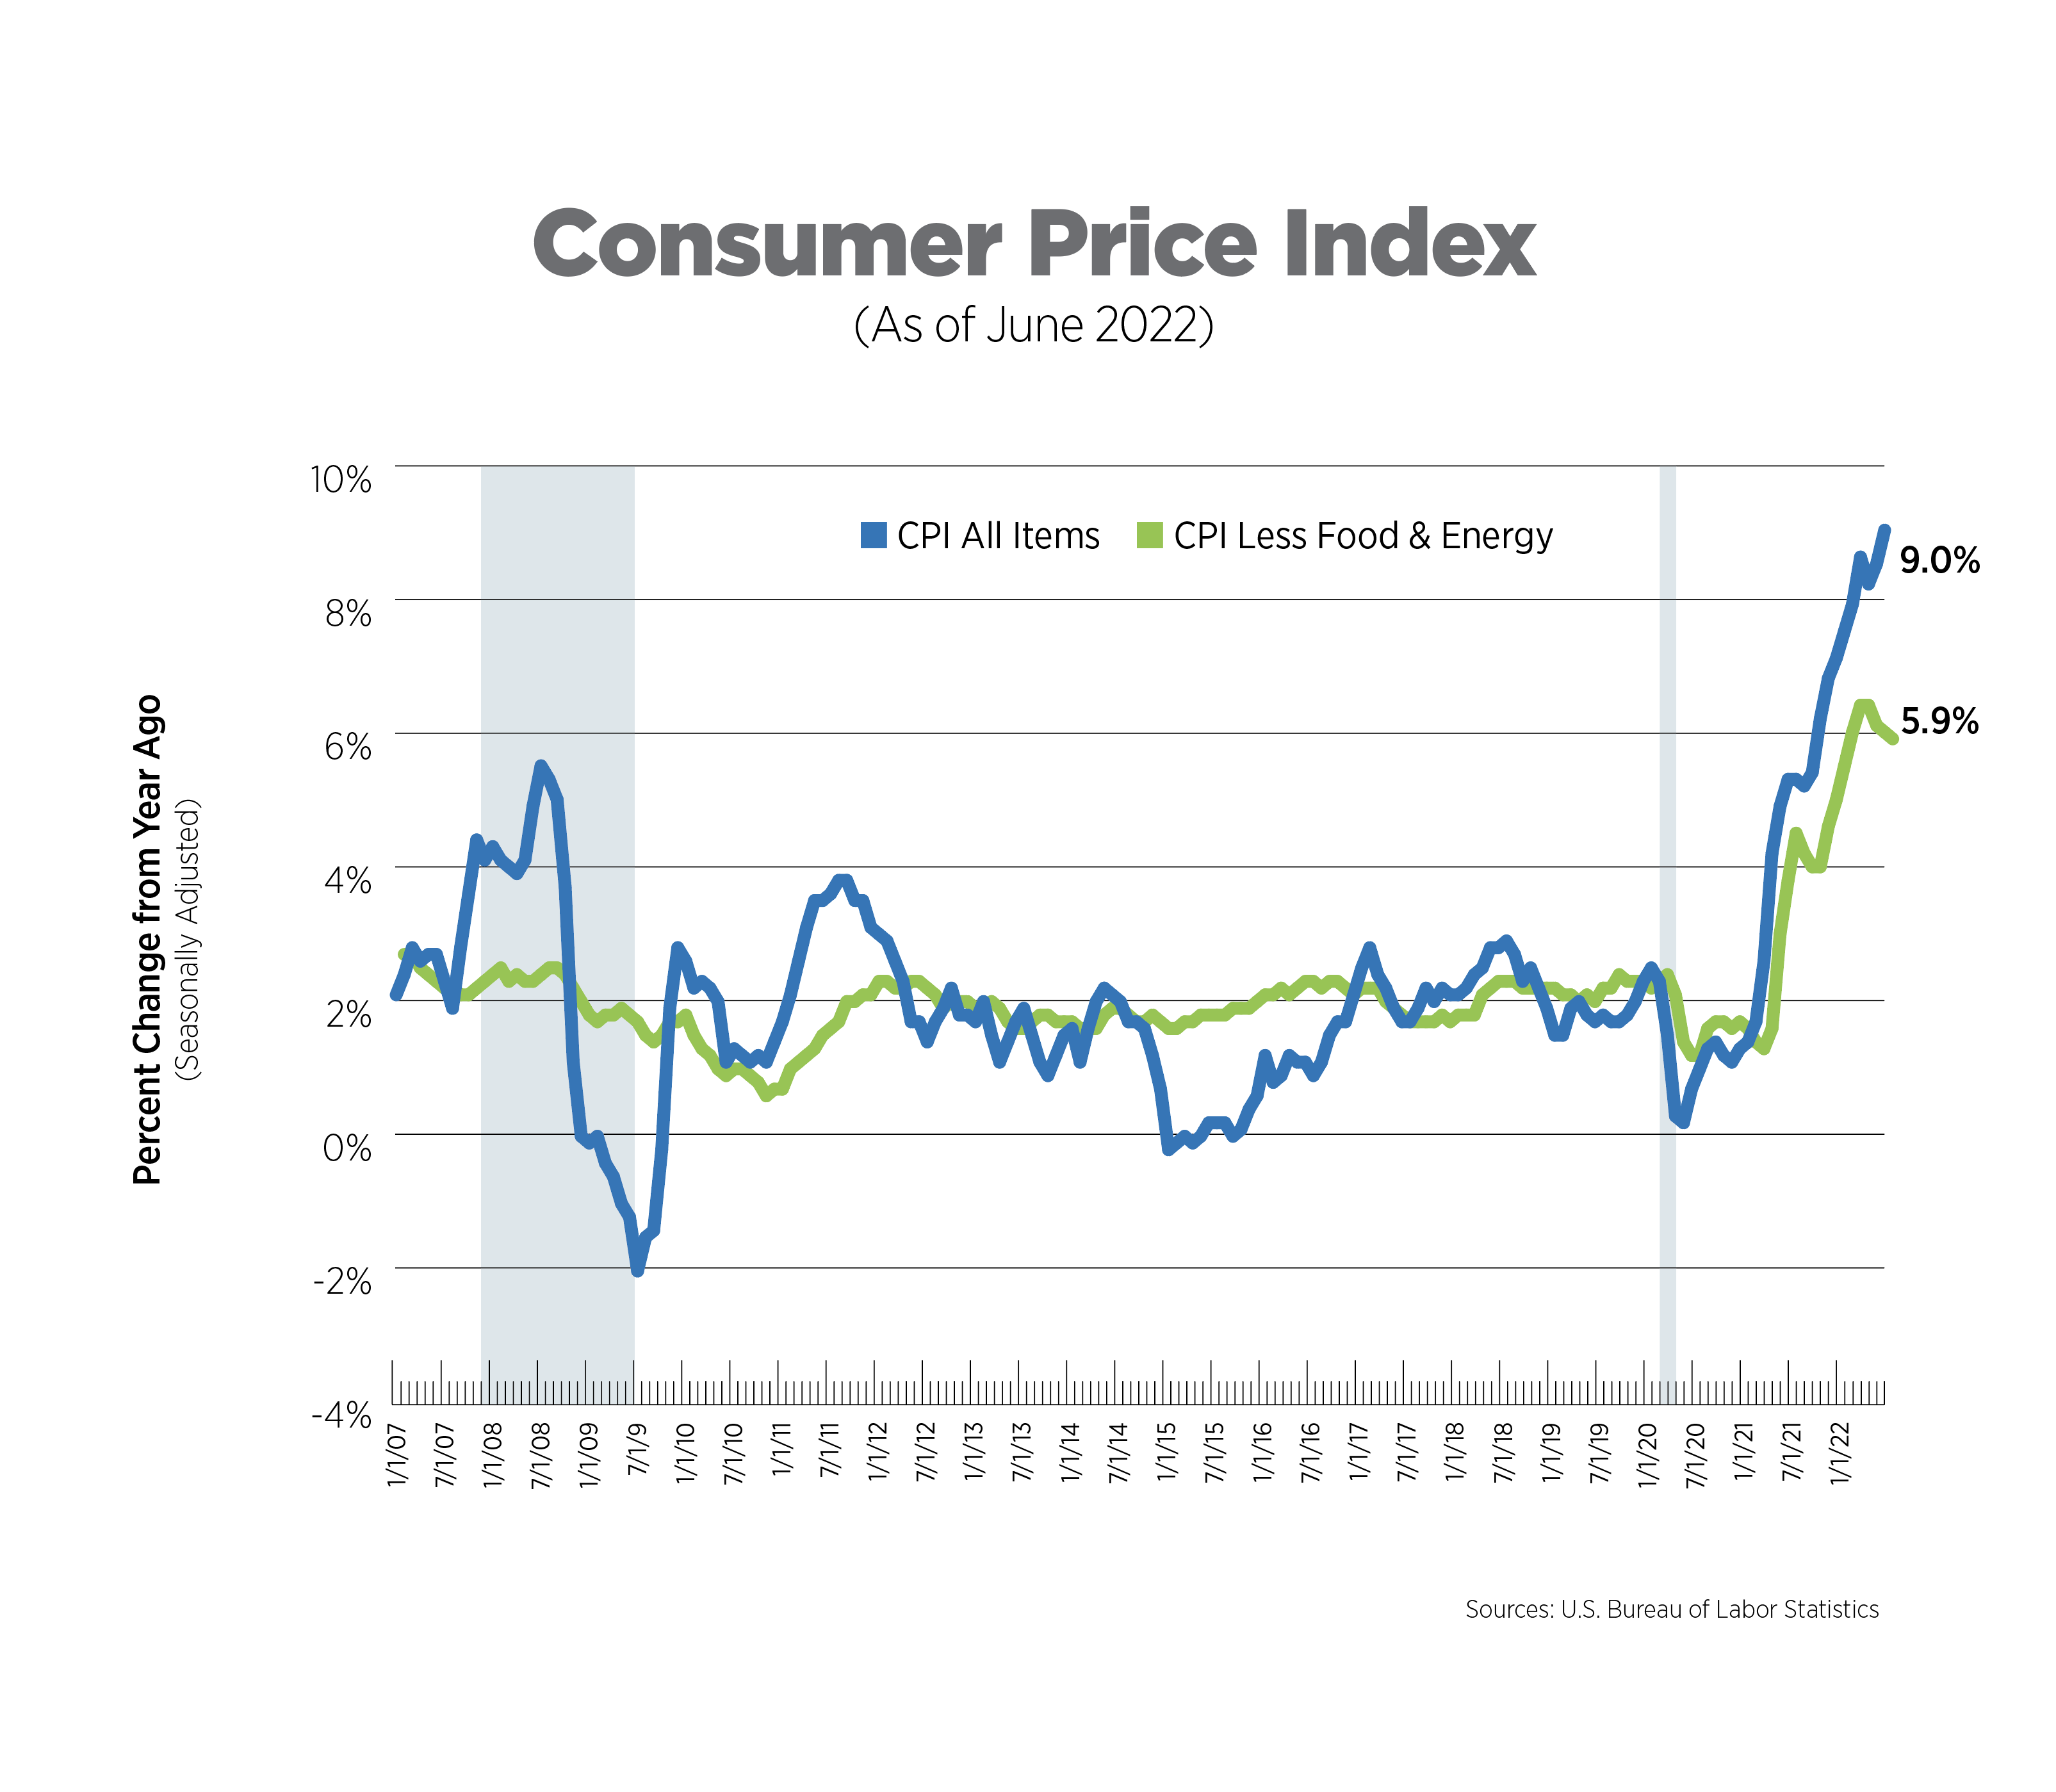
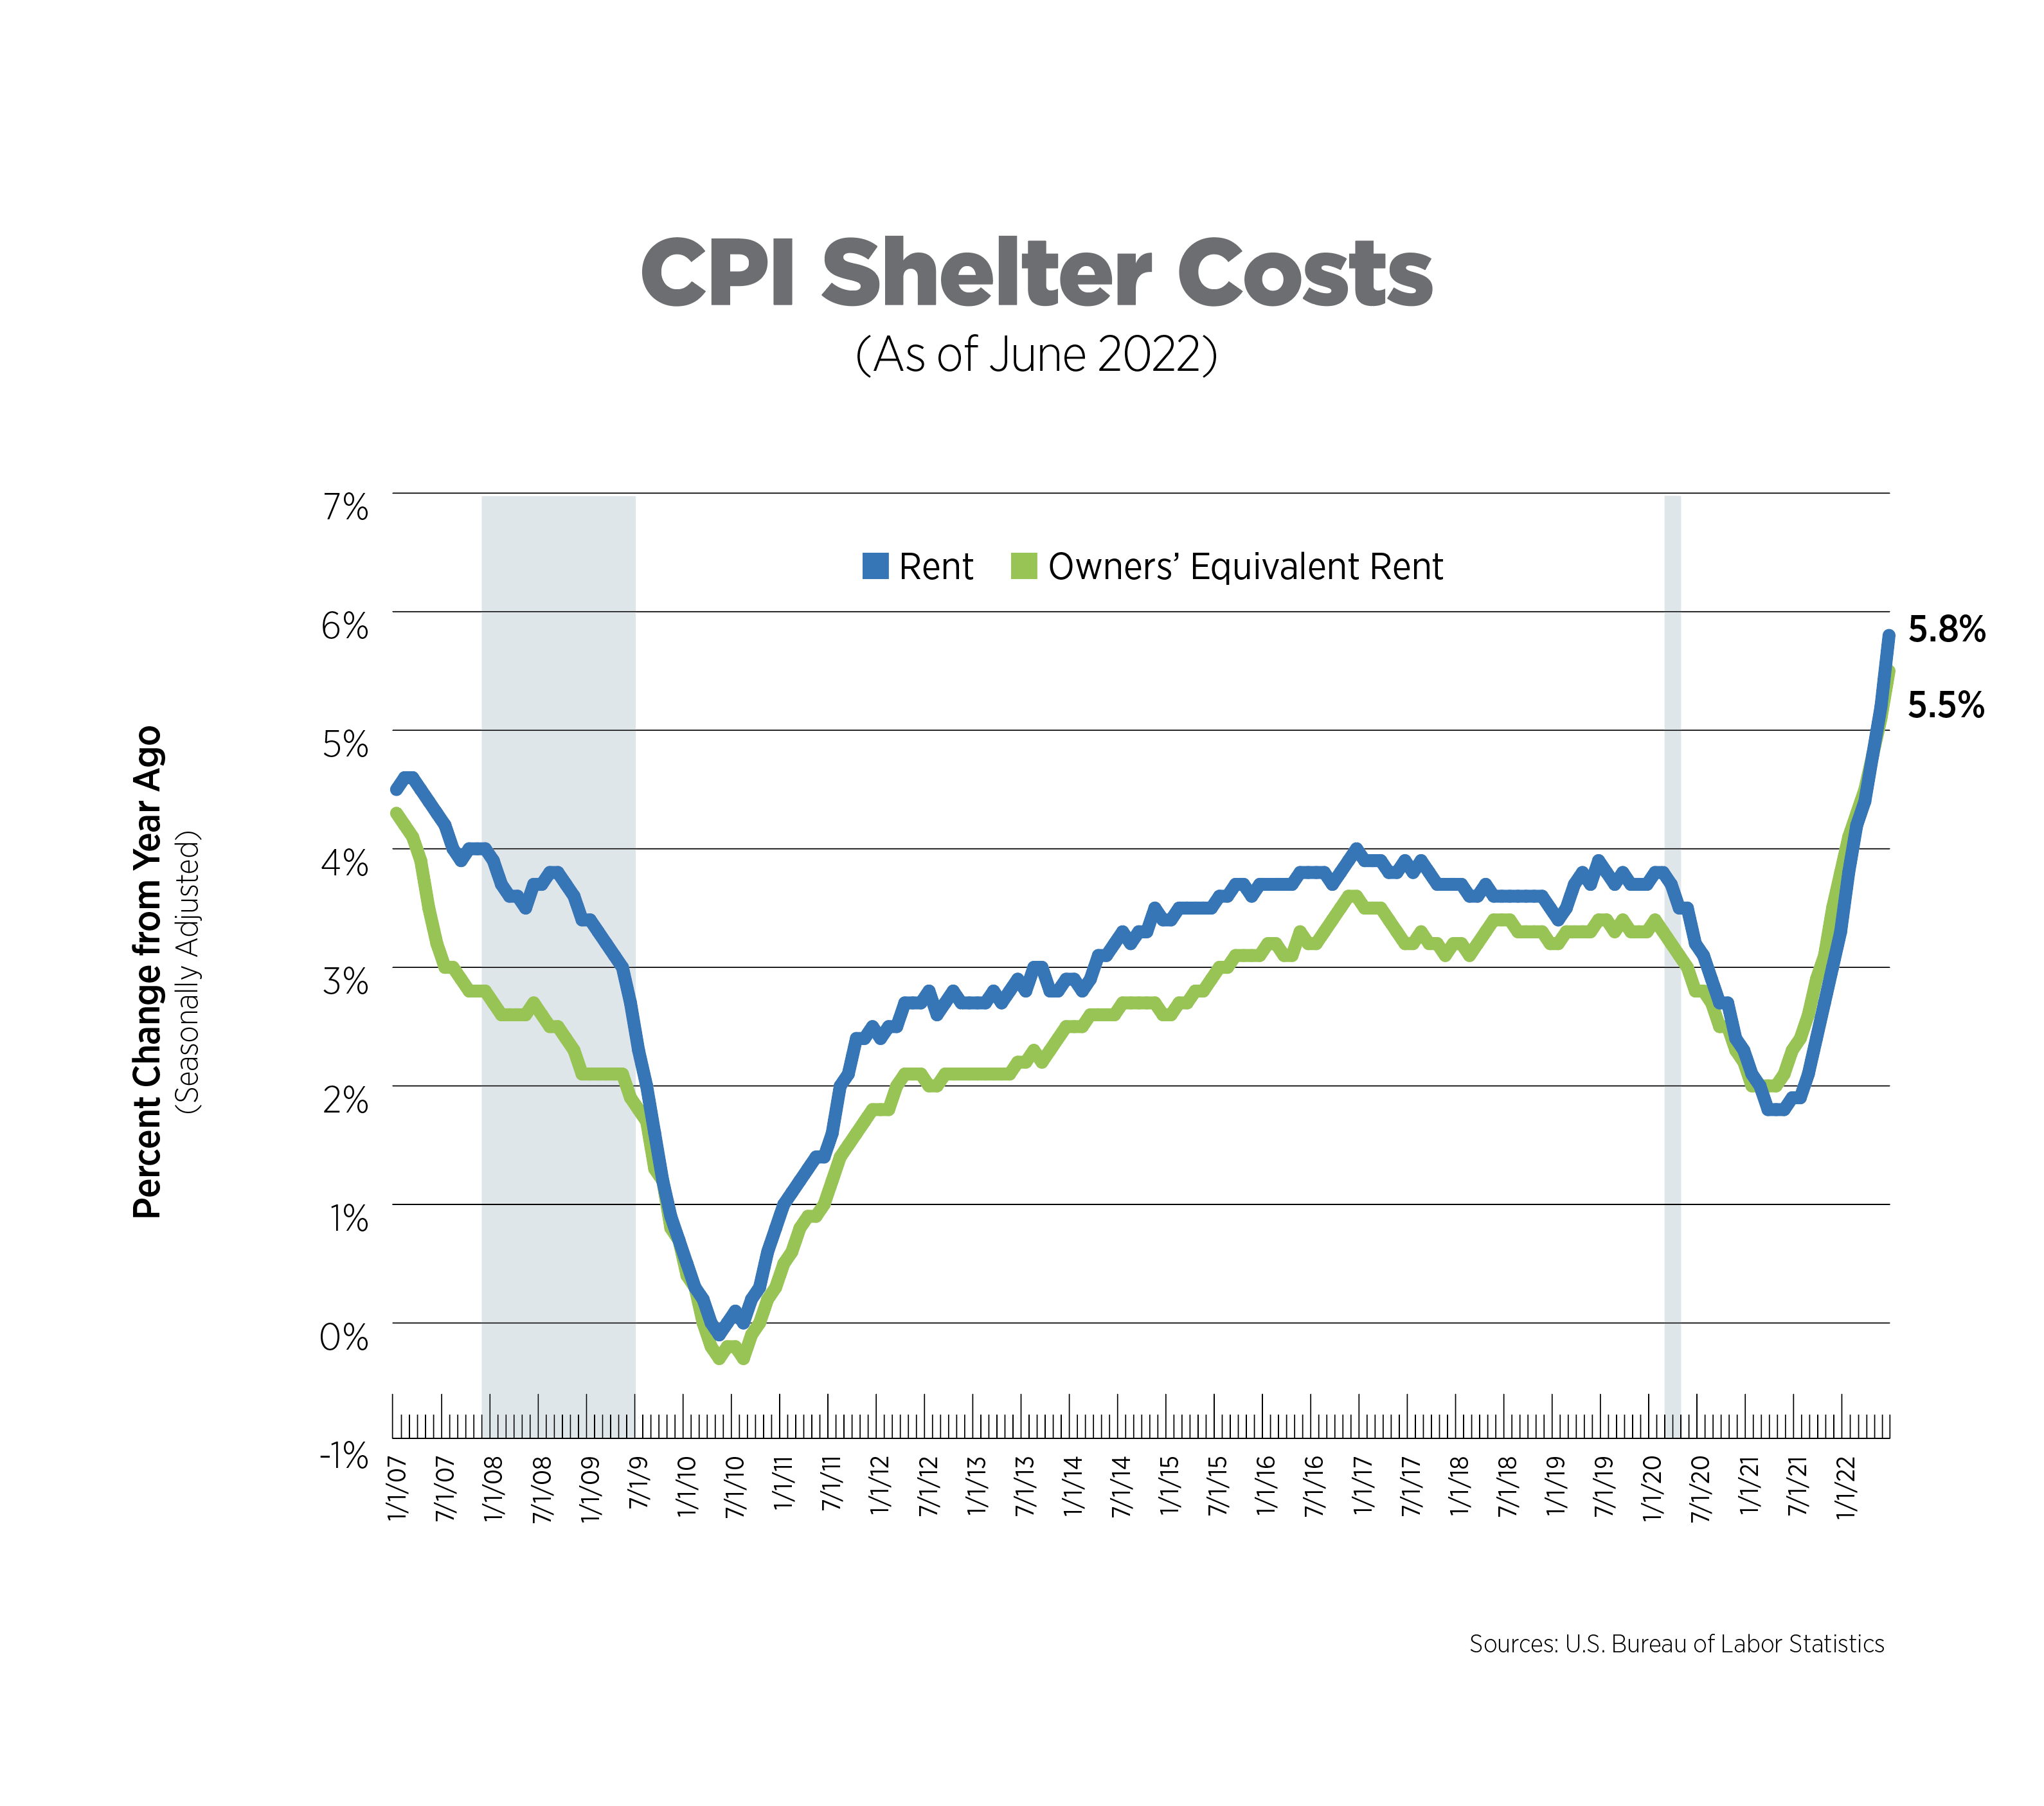
CPI for Housing, June 2022
The CPI includes two measures for shelter costs: owners’ equivalent rent and rent of primary residence, both of which are self-reported. Together, they comprise about one-third of CPI. Owners’ equivalent rent, which is the price owner-occupiers think they could attain if they rented their homes, increased 5.5% while rent of primary residence was up 5.8% year-over-year, the highest increase since 1986. It’s important to note that both measures lag actual changes in housing costs as the data are collected less frequently than other components of the CPI. Shelter costs are expected to accelerate further but may peak in the third quarter.
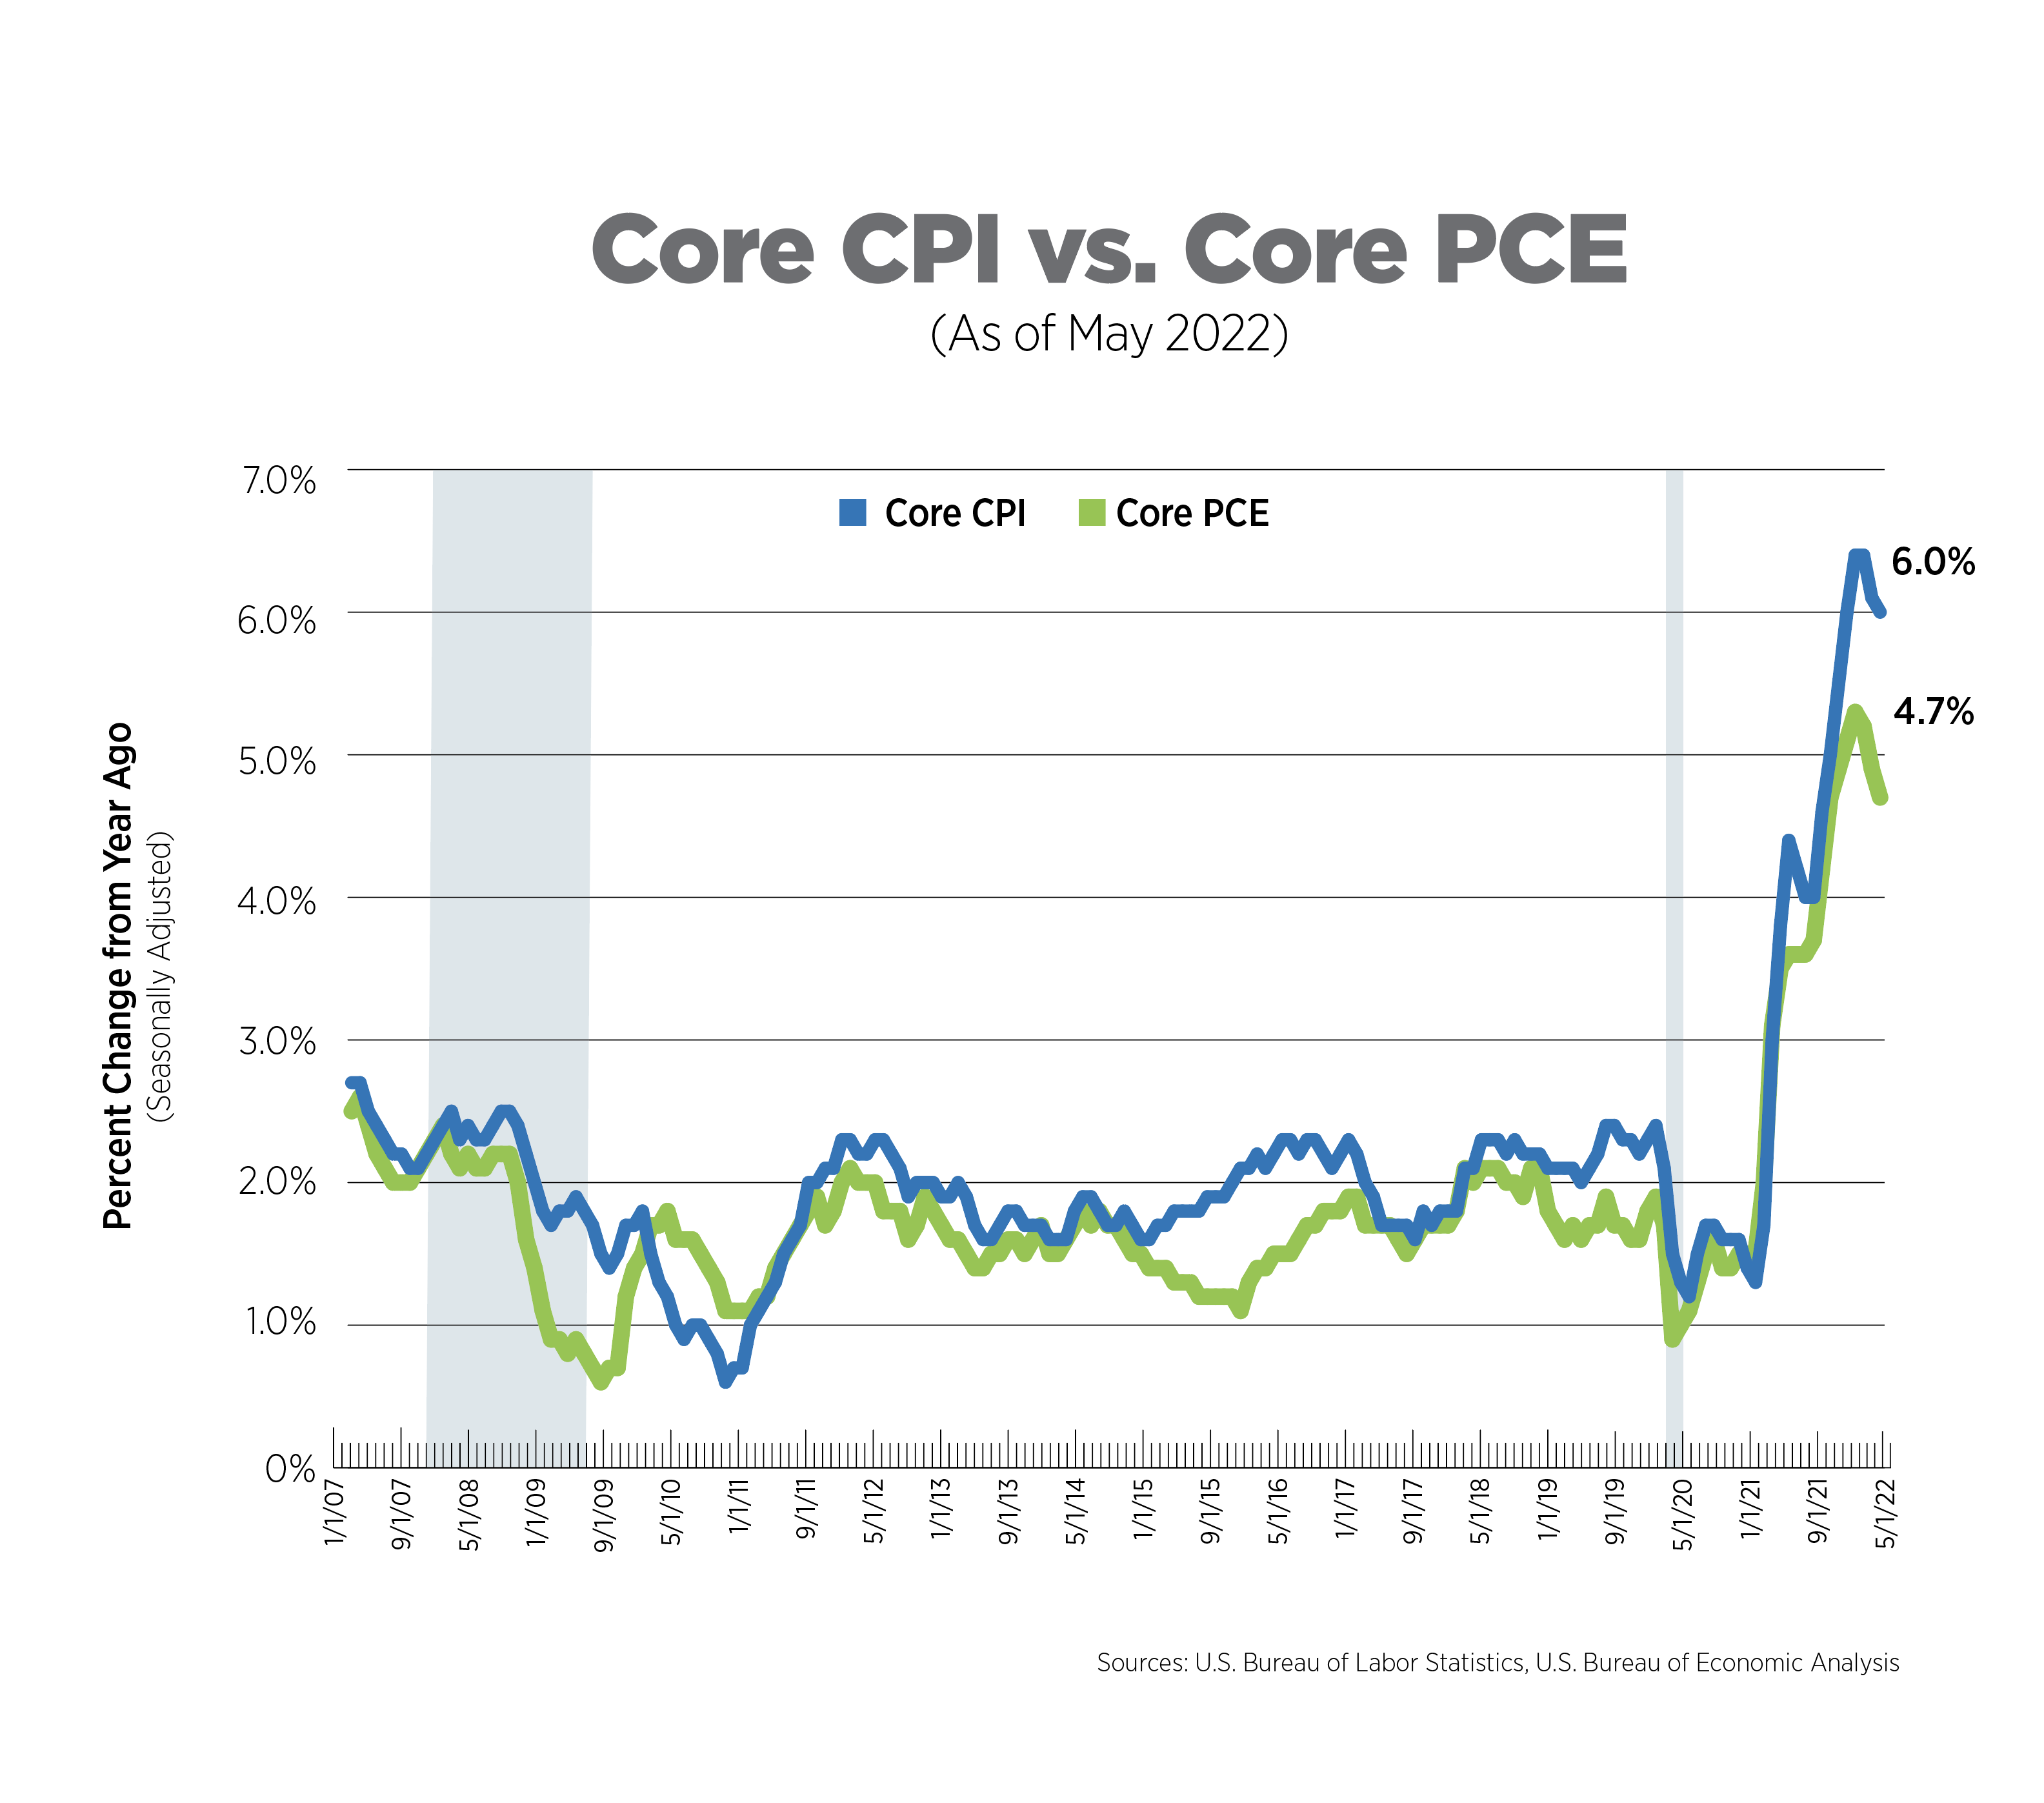
Alternative Measures of Inflation, May 2022
The core Personal Consumption Expenditures (PCE) Index is the measure of inflation the Federal Reserve Bank uses in its policy decisions. It is produced by the Bureau of Economic Analysis and uses different formulas, different weights and has a different scope compared to the Bureau of Labor Statistics’ (BLS) CPI.
Core PCE is showing signs of moderating on a monthly basis, up 0.3% over the past 4 months, down from 0.5% in the four months prior. On an annual basis, prices increased 4.7%, an uncomfortably high reading for the Fed and yet another signal to continue raising interest rates.
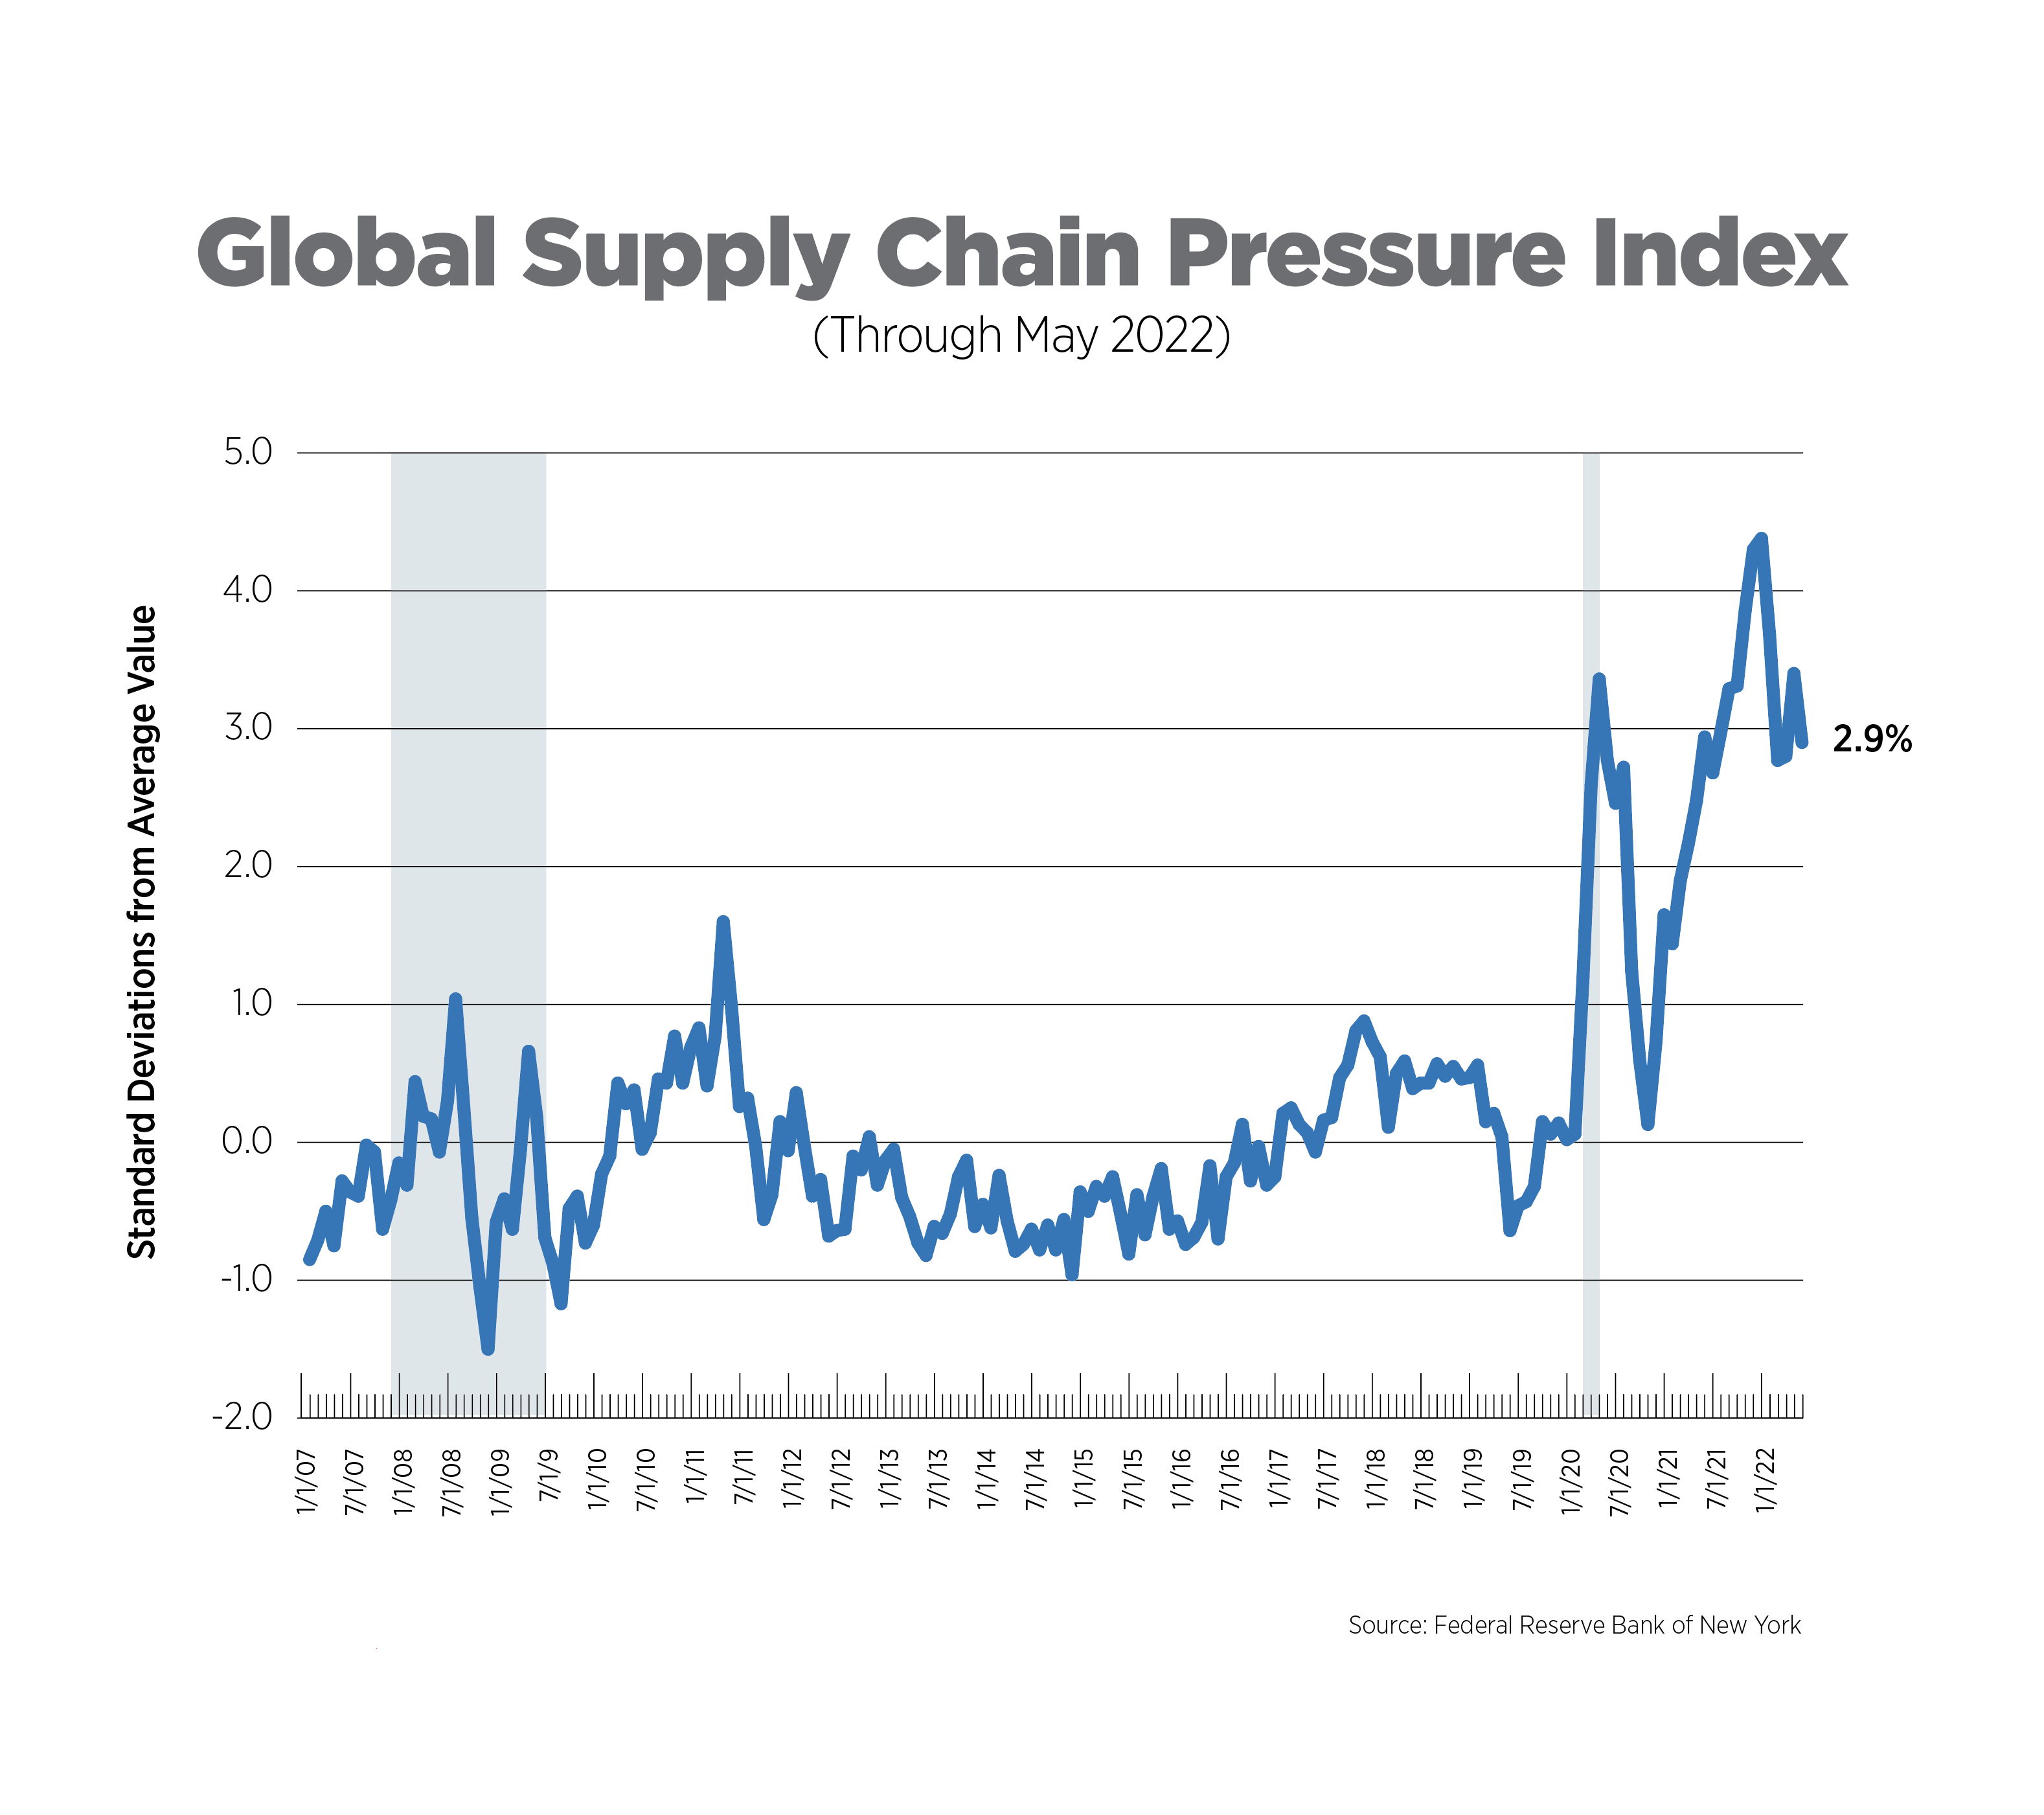
Global Supply Chain Pressure Index, May 2022
Supply chain pressures are just one cause of the spike in inflation. The Federal Reserve Bank of New York created a new index to measure stress in the global supply chain, using 27 variables from different countries, including shipping rates and delivery times. A value of zero indicates average conditions in the supply chain.
There are some indications that supply chain pressures might be easing a bit, but the index remained elevated at 2.9. The main drivers were delivery times in both China and the Euro zone, as Covid restrictions and the prolonged Russian war on Ukraine take their toll on the supply chain. Another component weighing down the index was airfreight costs from the U.S. and Asia.
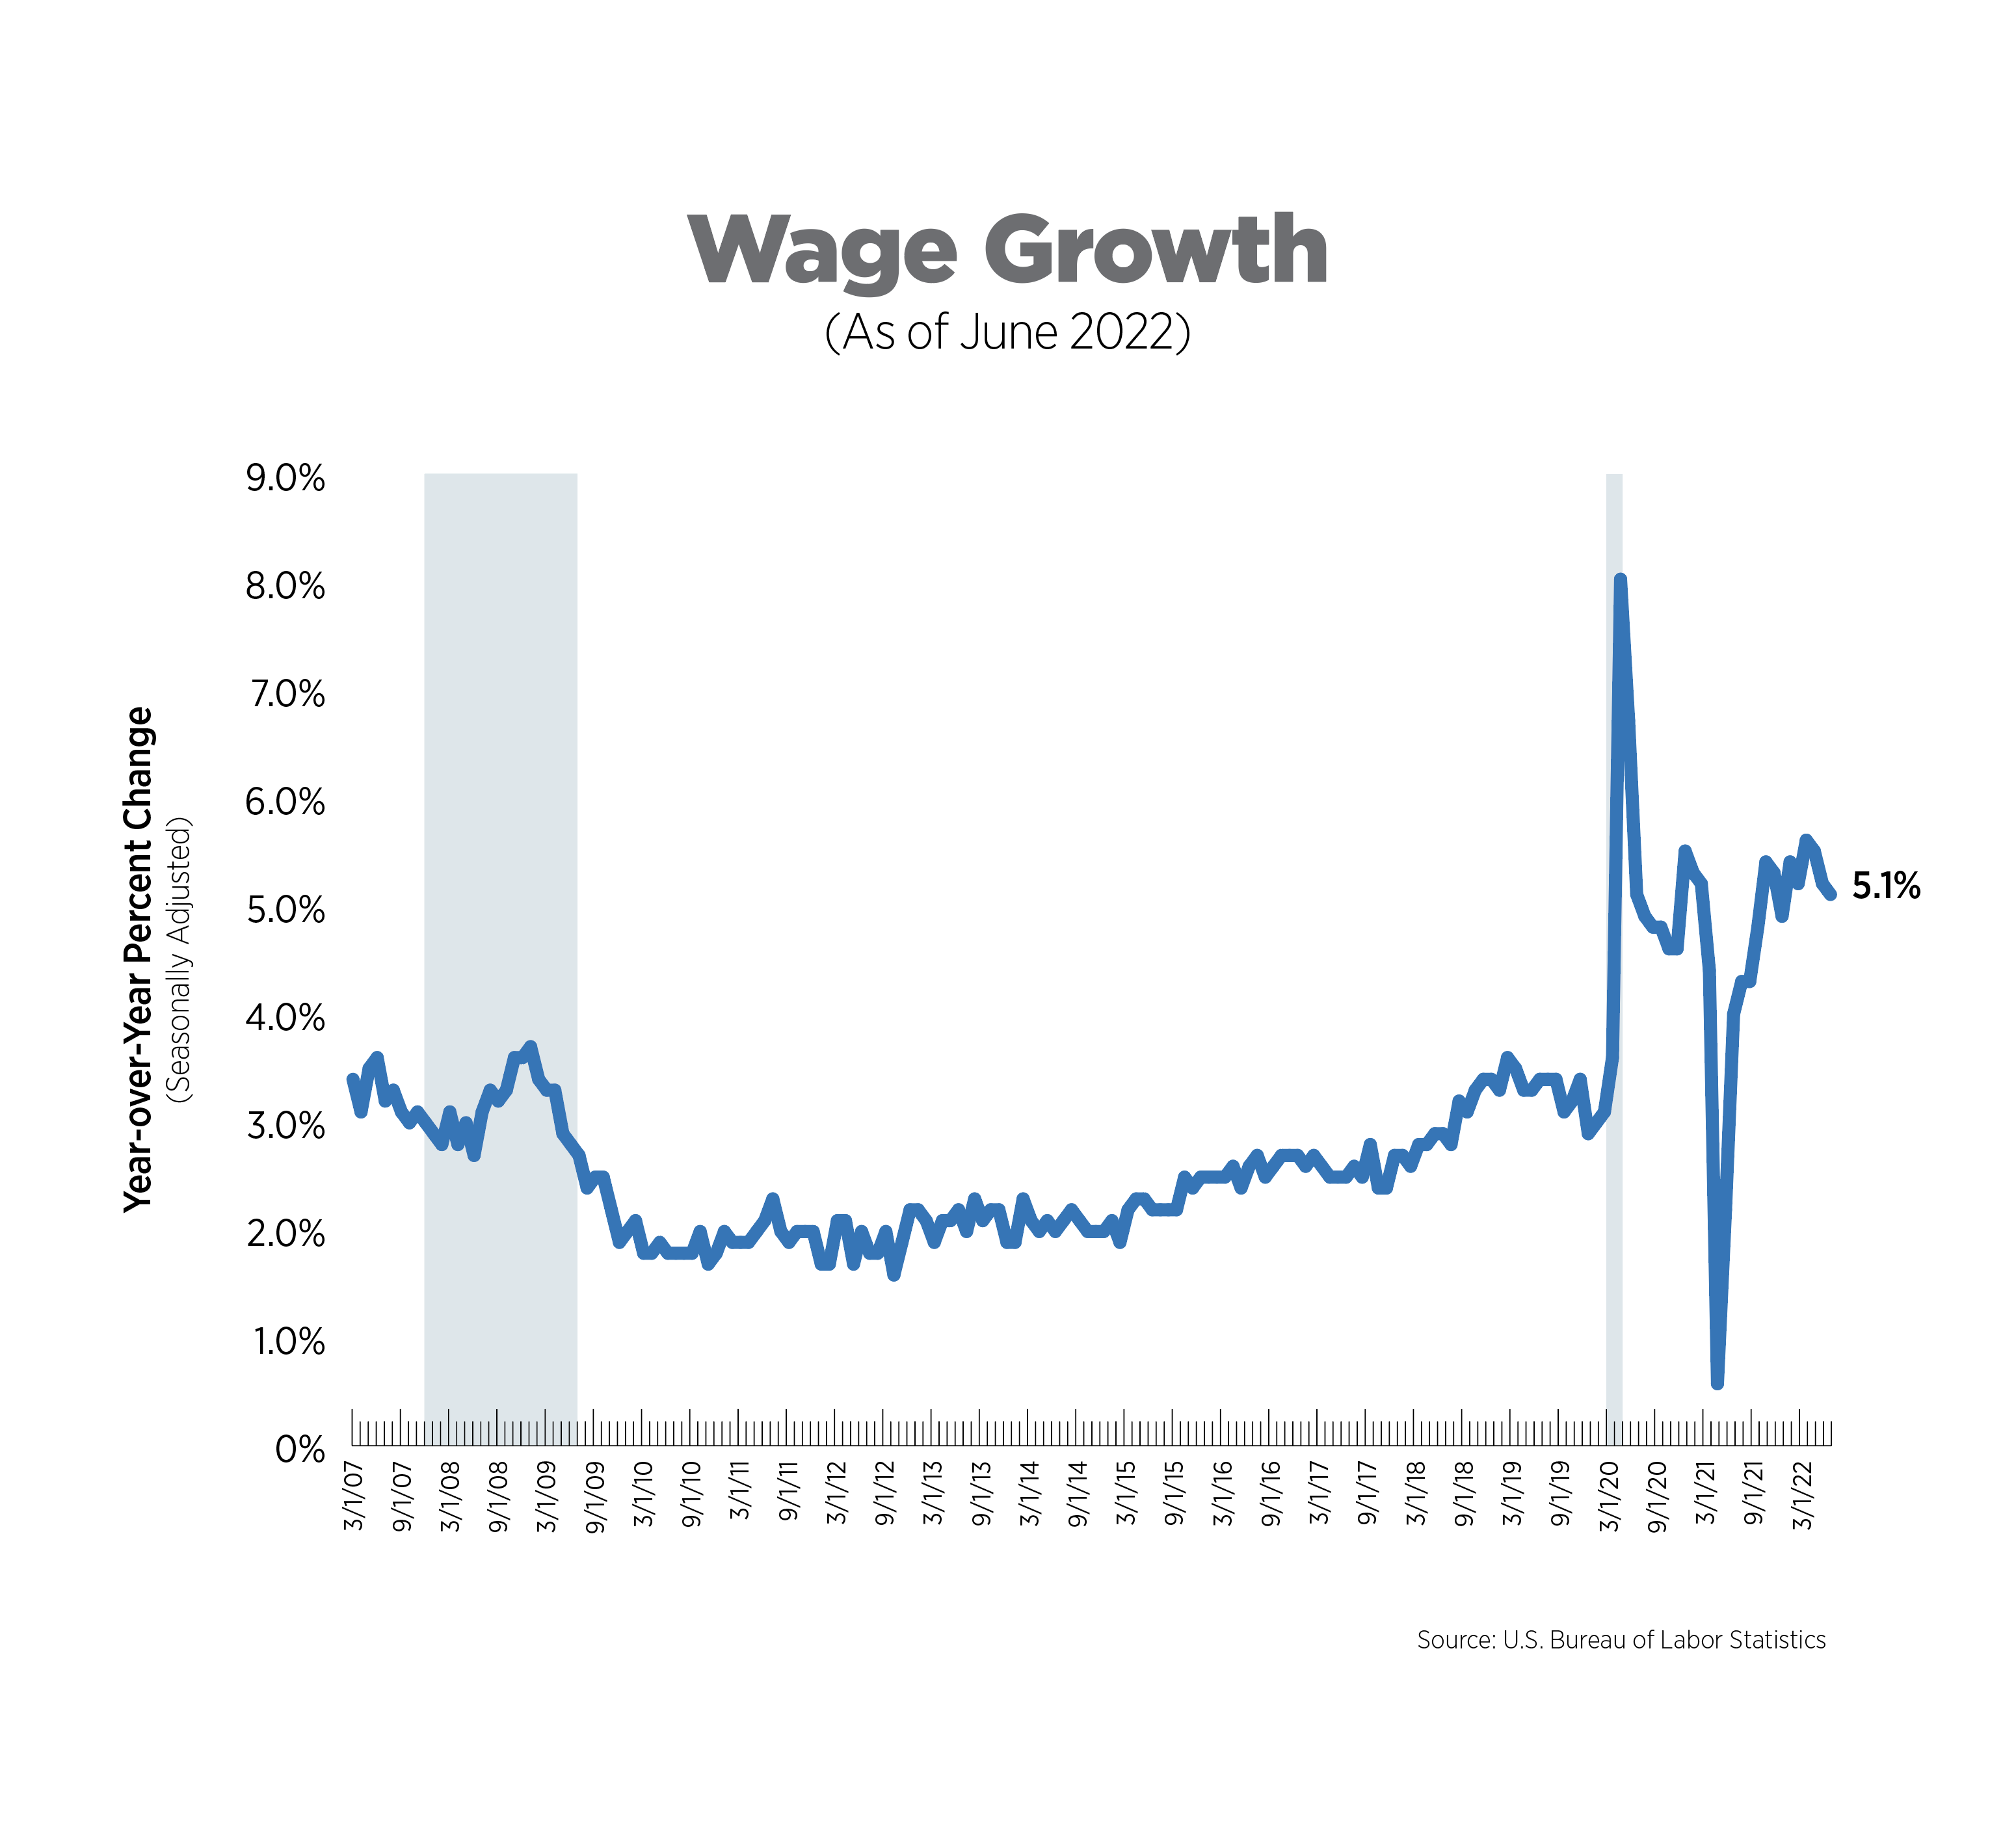
Wage Growth, June 2022
Although not keeping pace with inflation, wage growth continued on a strong trajectory, topping 5% year-over-year growth every month thus far in 2022. Six sectors saw wage growth which beat the national average: leisure/hospitality (9.1%), utilities (6.1%), education/health services (6.1%), professional/business services (5.8%), construction (5.6%), and transportation/warehousing (5.3%).
What to Watch in the Next Month
- The Fed meets on July 26-27 and given the most recent inflation and jobs reports, can be expected to raise rates by an additional 75 basis points.
- All eyes will be on the advance GDP estimate for Q2 22, to be released on July 28. The Atlanta Fed’s GDPNow tracker is forecasting another contraction, which would further fuel fears that a recession is imminent, if not already upon us.
Next Tracker: August 10, 2022
